����֤�顢����֤��
�����������ء����������ල����֤
֪��Ʒ�ƣ�ֵ������
רҵƷ�ʣ�������ྫΪ��ּ
����Ʒƥ���רҵ����ָ��
����ҵ�����䱸רҵ�Ĺ���ʦ������ָ��
�����ȫ�����Ǿ��ܿյ�UPS��Դ���в�Ʒ����
�������������������������
�߿Ƽ����ܼ���豸ʵ����
ѡ�ø߿Ƽ���ѧӰ�L��ɸѡ����ÿһ��Ʒ���������
ѡ����ˮ�����������ÿ���ε�ơ��ۻ���Ʒ���������
�䱸ģ��ʵ���ң�ÿ���γ�Ʒ��װǰ����ģ������
��Ʒ�����ۿͻ�����ȫ��
���ǵĿͻ��Ѹ���ȫ��
����24Сʱ�ͷ���ǰ�ۺ����
���������۲�Ʒ����������֤

ǿ��Ч�ʵ�һ���������Ŷ�
רҵ�Ŀͷ��Ŷӡ����Ƶķ�����ϵ
��Ʒͨ��ISO9001-2008������ϵ��֤
ȫ���Ƚ�����豸�����ϲ�ƷƷ��
52��Ʒ�Ʒ�չ���̡���������
��Ʒ������ȫ�������㣬һվʽ�ɹ�
������Hisense������ѯ�˽⣺0531-85235999
������ѯ
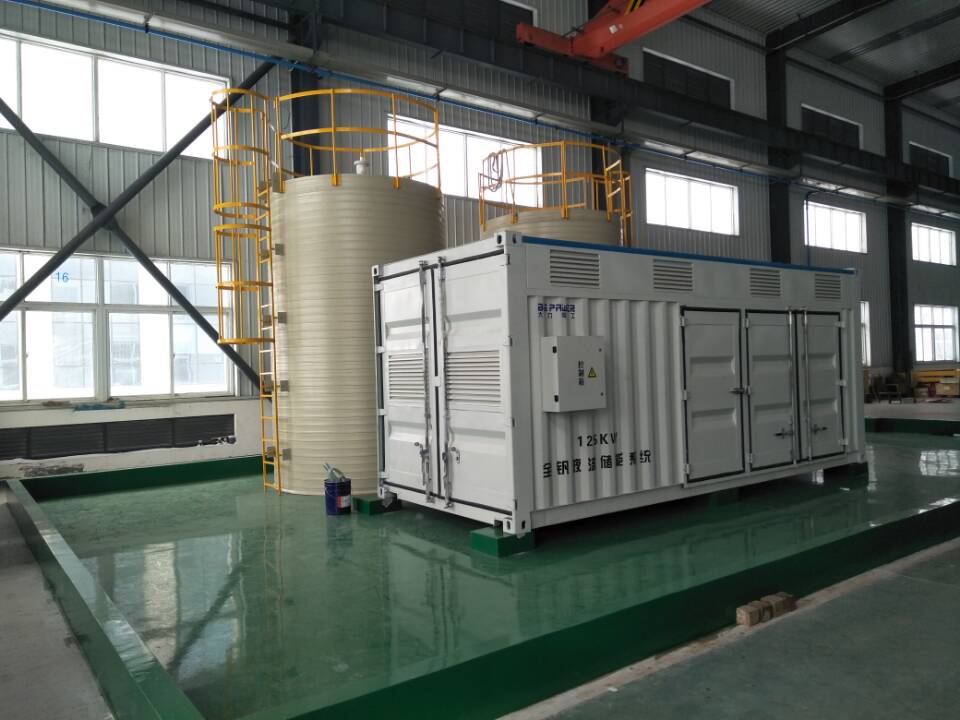
�����ܻ�����������˾������2011�꣬ע���ʽ�2100���ܲ�λ��ɽ�����ϸ��¼�������������һ��רҵ���µ������ӱ任������Դ�豸ϵͳ���з���������������һ��ĸ��¿Ƽ�רҵ����˾����Ʒ�㷺Ӧ�����ڵ綯�����������Դ�������ͨ��������ԡ���ͷ���������캽�ա��������ԡ������豸������Դ�����洦������ҵ�����ȶ���Ӧ������ �����ܻ������豸����˾�ϸ�ִ��ISO9001��2001����������ϵ��GJB9001A-2001������Ʒ�ʡ�����ϵ��ر�...
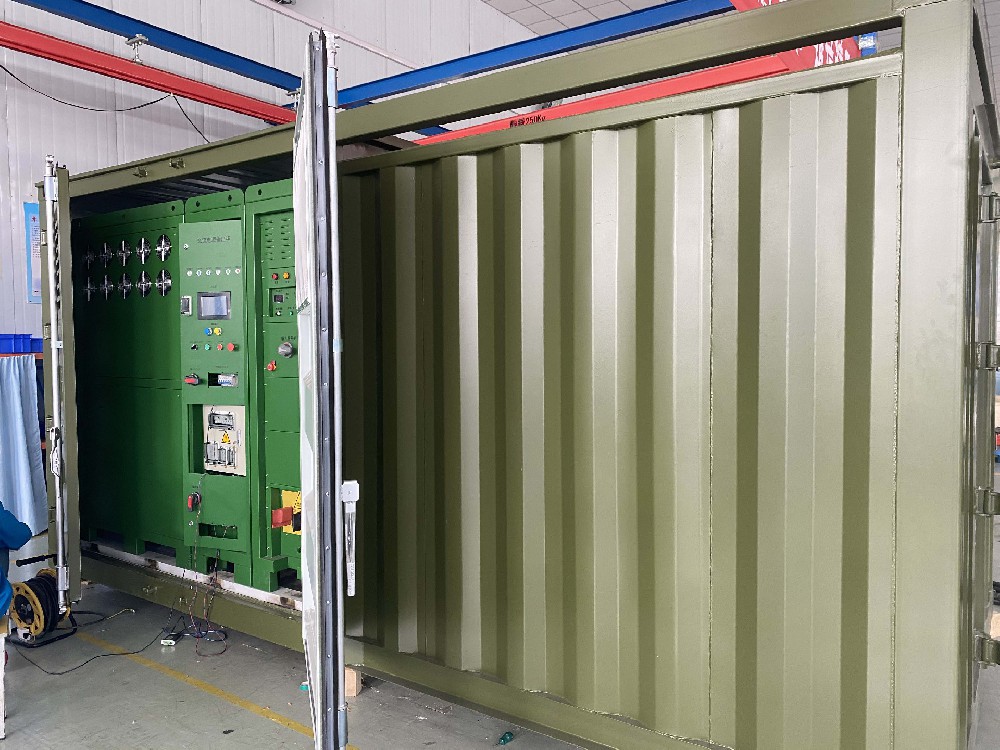
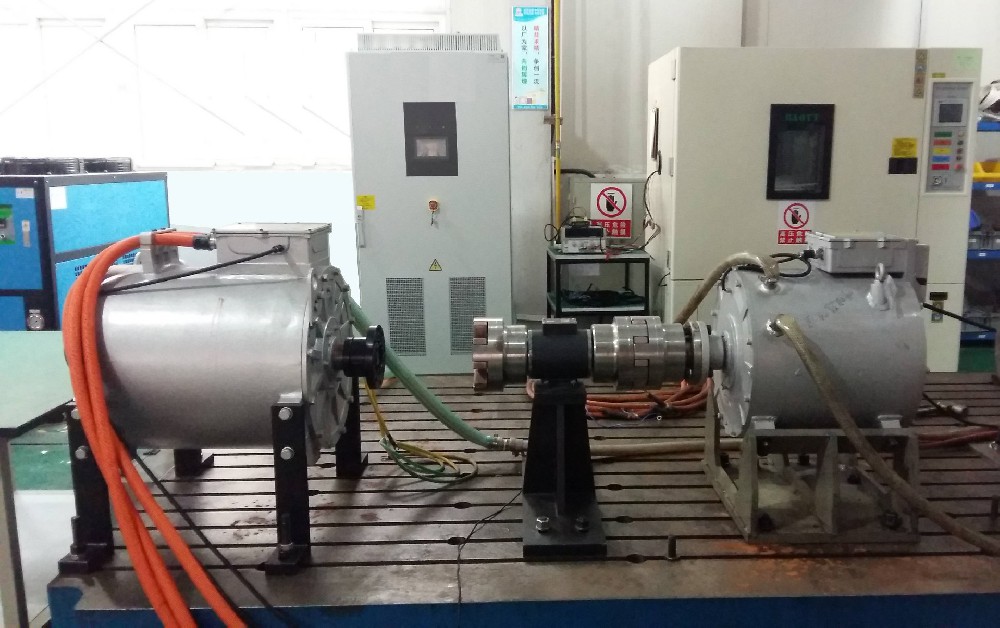
�鿴����˫��ֱ����ԴӦ���������˫��ֱ����Դ��רΪ����Դ�綯������ҵ�ij��س������������������������������IJ�������������ģ�Ӧ���ڴ��綯�������������ϵ��ͳ���Ժ��͵��϶������ϵͳ�������ϻ��������ͳ�������ة����ṩ��Ч���ͳɱ������IJ��Խ��������˫��ֱ����Դ����������PWM����������˫��DCD...
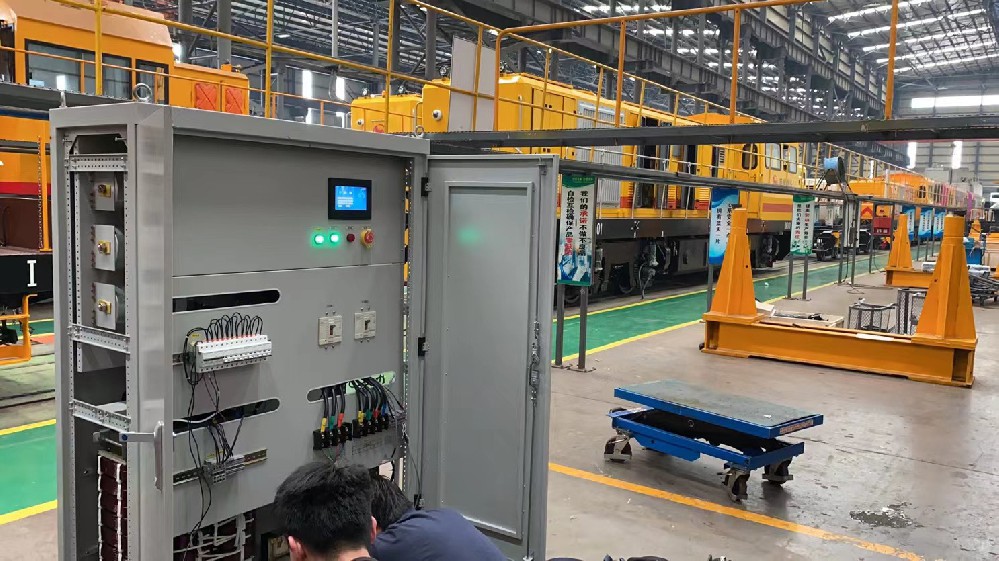
1������ԭ��˫��ֱ����Դ��ͨ�����������������е罻����Դ�����任������������˲��Ȼ���ת���Ϊ�����ڵ綯������硢����Դ���ú�������������ĵ�Դ�����������ԭ����ͨ����ʽ������·��˫��DC-DC�任����ʵ��������������ת��������ʵ�ֵ�Դ����͵��ܻ���������ڴ�ͳ�ĵ���DC-DC��Դ�͡���ͨ������Դ��˫��ֱ����Դ����...

��ɨһɨ


 �ͷ�
�ͷ�